Posts

Showing posts from September, 2016

How to understand PurpleAir sensor readings

Image
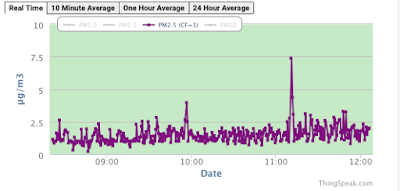
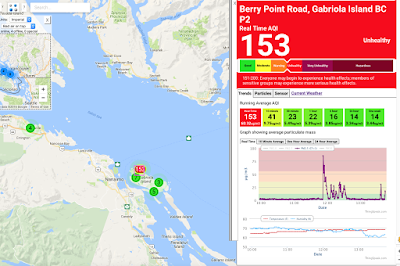
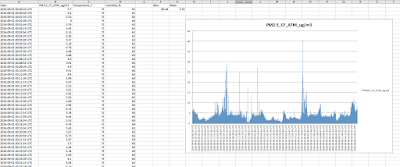
Air pollution has a unique signature depending on the source or sources, location, baseline, magnitude of change, and the mechanisms by which it is produced. He re are some simple ways to identify what's happening when reading PurpleAir monitors like what we have  here . The first image is from a rural community. Note the good quality air with PM2.5 levels between 1 and 2 with a sudden but short-lived spike to 7.5 at 11:15AM. This is a pattern I have seen before and it represents a dirty diesel truck (most likely a water truck) going past the sensor. The second image represents normal variation on a good air quality day.  The third image is from a city with the sensor reflecting activity from a local pulp and paper mill and local traffic. The last image is a rural community snapshot of a good day punctuated by what happens when a wood stove or fireplace is lit nearby. Note the sudden and dramatic increase in pollution and the saw tooth pattern as the stove get to

Bearing witness to harm by thorough documentation

Documenting wood smoke pollution is an important and necessary step toward increasing awareness of its behaviour and effects. Taking photographs and measurements of wood smoke pollution is not a crime - even if uninformed local police departments believe that doing so is a kind of criminal harassment. For example, Metro Vancouver suggests that the following be pursued if wood smoke from a neighbour is having an impact on you: - Keeping a wood smoke diary to record the frequency of incidents and their impact on you and your family. - Talking to your neighbours to see if they are affected and willing to make impact statements. - Taking photographs or video of the smoke, especially if it enters your property. - Contacting Metro Vancouver as soon as you observe wood smoke so that an Officer might attend the scene. - Giving permission to Metro Vancouver to set up monitoring equipment on your property.

The hyper local effects of wood smoke

Image
The PurpleAir PM2.5 network shows in real-time exactly the contribution of wood smoke to the air shed. Here's a snapshot of air quality readings from just a moment ago from one of our sensors on Gabriola Island. Note the readings of the other sensors nearby and in Parksville. This is not industrial pollution, vehicles, road dust or anything else except a neighbour near this sensor who continues to burn wood in spite of the evidence of harm. Note the telltale pattern of combustion with cooling and the addition of more wood. Also, compare this to the air quality reading from the same minute taken at a monitor close to the Harmac Pulp and Paper Mill in Nanaimo.

A week of data from one of our monitors

Image
With the PurpleAir monitors that we now have running in Canada, data can be downloaded and analyzed like this. Here's data from one sensor on Gabriola Island for the first week of September 2016 on a minute by minute basis. This chart is based on 12,748 samples.

Live Feed Of Air Quality From Gabriola Island And Parksville

Image
The PurpleAir monitors are working extremely well and provide useful real-time data that looks like this in map form. By clicking on an individual monitor and going to the Real Time tab you will see trend data like this. To access our monitors click  here .

Article in the Nanaimo News Bulletin about our PurpleAir network

Here's a nice article in the Nanaimo News Bulletin about our new air quality monitoring network.  "Gabriola Islanders are taking air quality monitoring into their own hands. The Gabriola Clean Air Society is using citizen scientists in a monitoring network aimed at educating people about how varied air quality can be and what people can do to address pollution. Four air quality sensors are now on Gabriola Island and one in Parksville."